

Introduction
In my last article called Borrowing the Doom Eternal Console, I've shown you how reverse-engineers get to work and explore the game code to leverage the existing functionalities to make their lifes easier. The journey included identifying memory addresses, decoding the console's coloring scheme, and in the end, using the game's code for out intentions.
I demonstrated DLL injection for seamless integration of custom C++ code, emphasizing the power of leveraging existing functions for modding. Integrating high level code makes the mod development a lot easier but calling functions isn't the only thing it allows us to do.
We also reverse-engineered the idStr class in the last article in order to determine if we were at the right end of the console printing call chain.
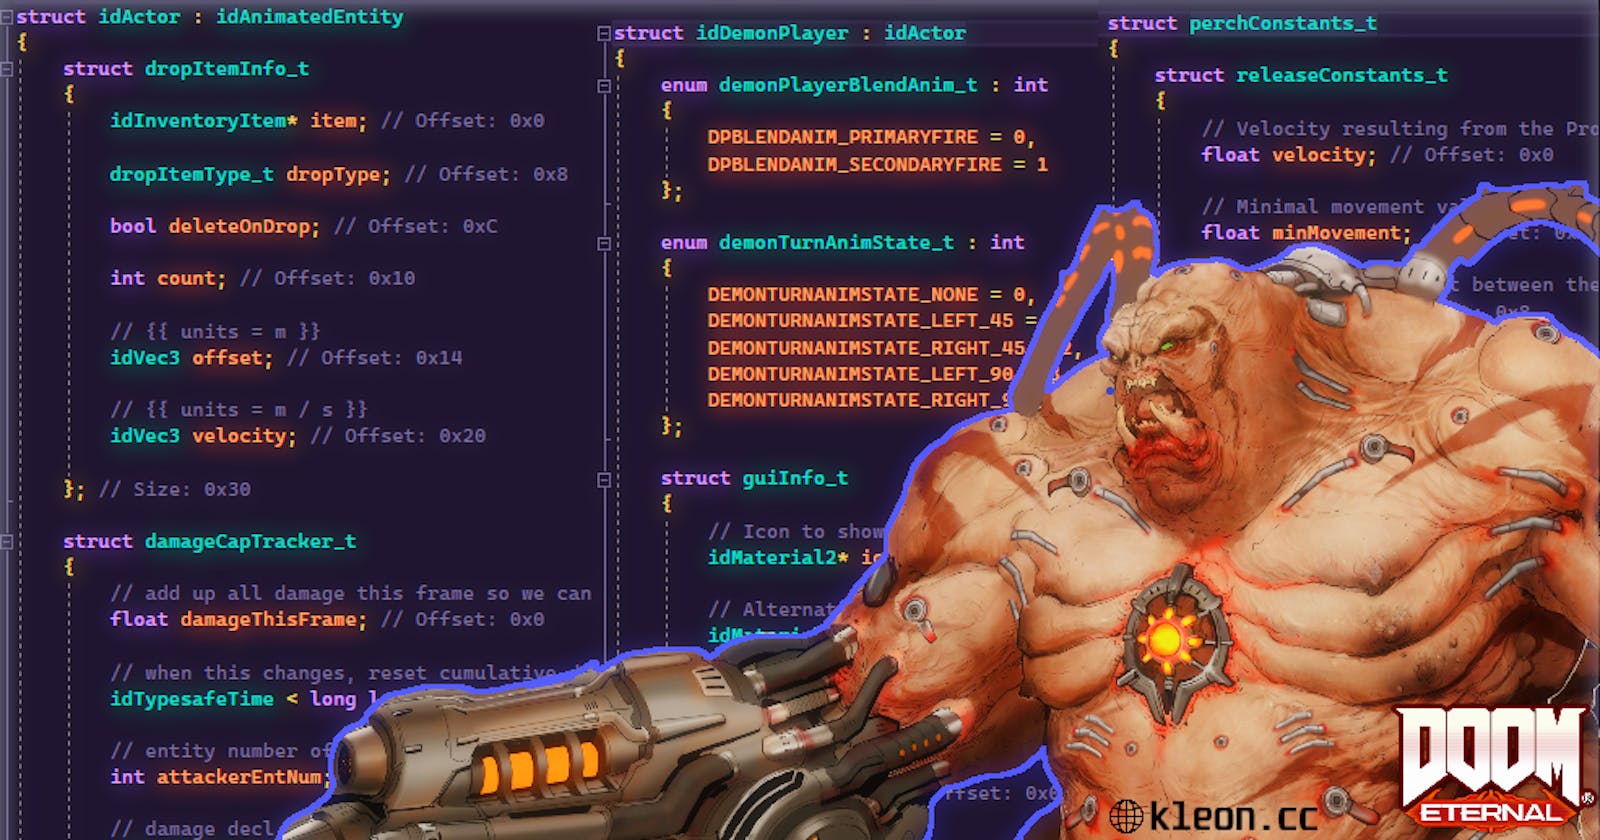
This kind of high level reconstruction of a class is key to writing a readable and easily maintainable code. After all writing demon->health = 1f; is a lot easier to manage then *(float*)(pTarget + 0x18) = 1f; and such cursed lines.

The Doom PDB
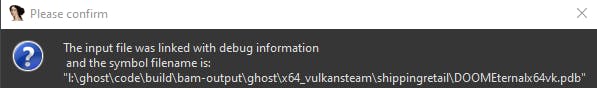
Doom Eternal, upon its initial release, was accompanied by a PDB file—a Program Database file—a crucial component in the realm of software development. PDB files are instrumental for developers, serving as debugging information repositories that store details such as variable names, data types, function names, and source code line numbers. This wealth of information significantly aids developers in debugging and analyzing their software during the development phase.
However, the utility of PDB files extends beyond the realm of game development studios. Reverse engineers exploring the intricacies of Doom Eternal's code find these files particularly valuable. The detailed insights provided by PDB files can streamline the reverse engineering process, offering a roadmap to the inner workings of the game.
The story takes an interesting turn when we consider the multiplayer aspect of Doom Eternal.

Recognizing the potential implications of having readily accessible PDB files in a game with a significant multiplayer component, developers made a strategic decision—post-launch, the PDB file was removed from the shipped files. This move was aimed at safeguarding the integrity of the multiplayer experience and preventing unintended exploits that could arise from an overly transparent understanding of the game's internals.
The absence of the PDB file, however, introduces an additional layer of complexity for reverse engineers. Without this comprehensive debugging information, the task becomes more challenging. Reverse engineers must now employ alternative methods, such as dynamic analysis, pattern recognition, and trial-and-error, to decipher the game's underlying structures and functions.
The idTech TypeInfoGenerator
As you might know Doom 3 has been open-sourced in 2011, allowing is to take a peek at the state of the old idTech engine and tools. The TypeInfo generator in Doom 3 is a tool that parses game source code, extracts information about constants, enums, class members, and classes, and generates a header file. It is primarily used for memory debugging, aiding in tasks such as detecting memory leaks, collecting allocation statistics, and identifying uninitialized members in game objects during runtime.
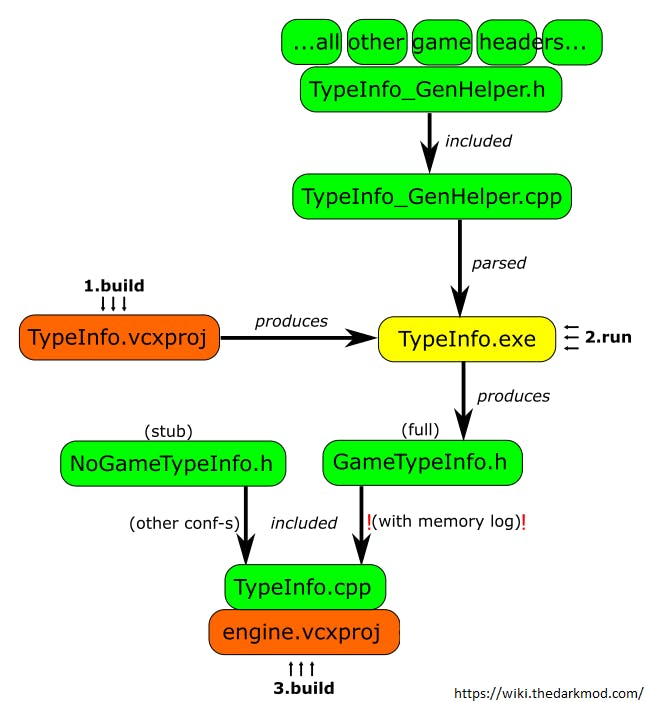
This internal tool has been carried over to the following Doom games to support the engine's development. The generated typeInfo is a null terminated C array of custom structs that gets included at game compilation. As it's a global constant variable the compiler incorporates it into the executable's .data section.
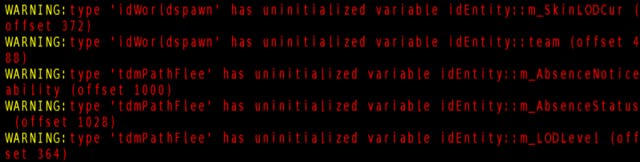
Upon closer examination of the program's behavior, it appears that the data is accessed through the idTypeInfoTools functions. These functions serve as helpers, responsible for reading the previously mentioned constant data and parsing it, making it ready for future tasks such as printing debug messages into the developer console or even graphing using the studio's tools.
Here's an example of what such reports look like that uses this generated data:
The Result
Using this information and the knowledge of code behavior acquired through static analysis, we can reconstruct the following structs responsible for holding the generated data.
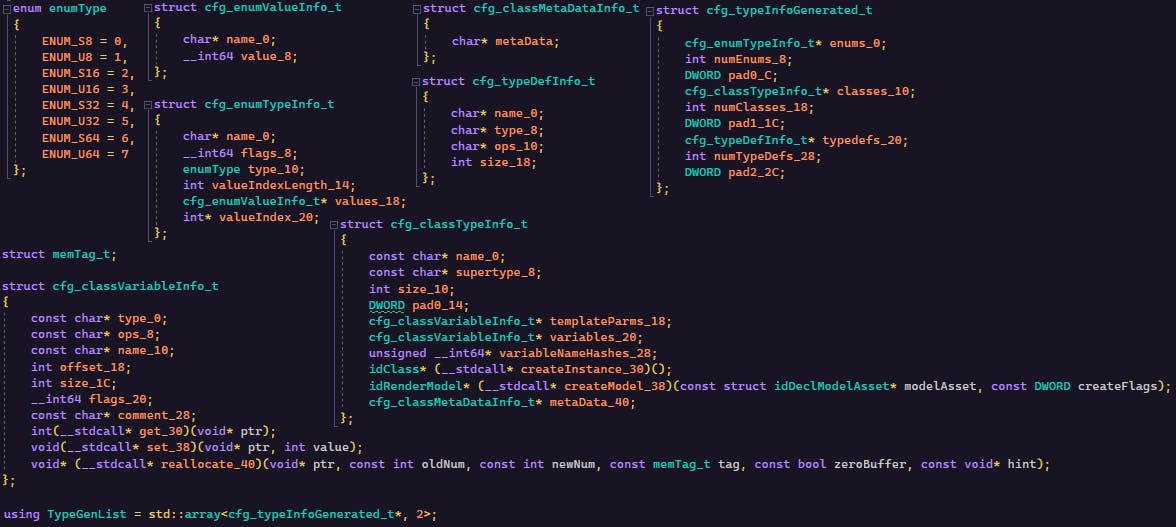
Utilizing these struct declarations, we can dump all the data generated through the previously mentioned build chain. Although the initially dumped information may lack sophistication, after a few days of programming magic, I was able to reconstruct human-readable C++ code with proper scoping, including:
1,137 standalone enum definitions [~620Kb]
398 standalone typedef declarations [~32Kb]
6,673 class stuctures [~7.6Mb] (even templated ones) including their inheritance chain, owned enums, typdefs and members with their exact memory offsets. Oh and have I mentioned the developer comments?

Classes lack virtual function declarations, unfortunately, and compile-time used variables are not present either, sadly. Despite these limitations in the data dump, the amount of information gained from this should not be underappreciated, in my opinion.
You can access all the reconstructed classes on my Github. I sincerely hope you will find good use for this information.
Till we meet again!